Log replayer#
The log replayer is a tool to help user to visualize logged data with plots, mutltiplots, events player, text logs player… All the data are synchronized using logger timestamp which is logged for each data type.
Extract logs#
The binary log with extension .binDM has to be extracted first to be replayable. You can proceed with
The online tool (100MB max): Log extractor
Log processing tool: Log processing tools, Log processing git
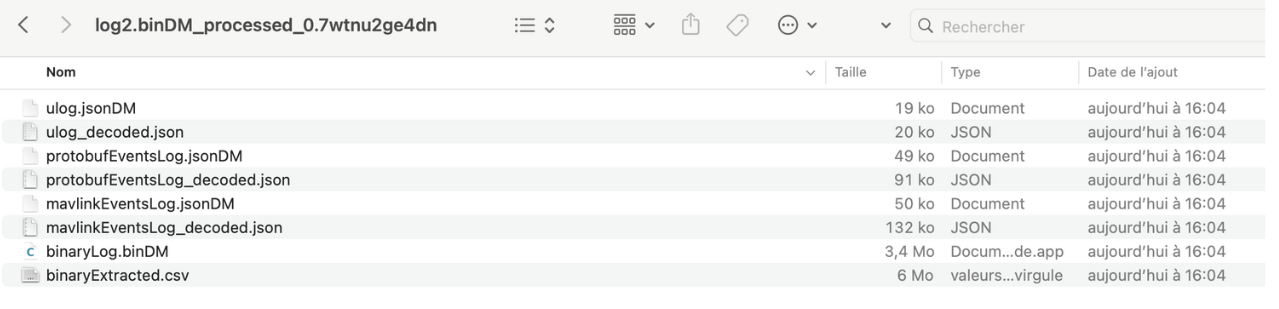
The resulting files that can be used as inputs are:
Replayer presentation#
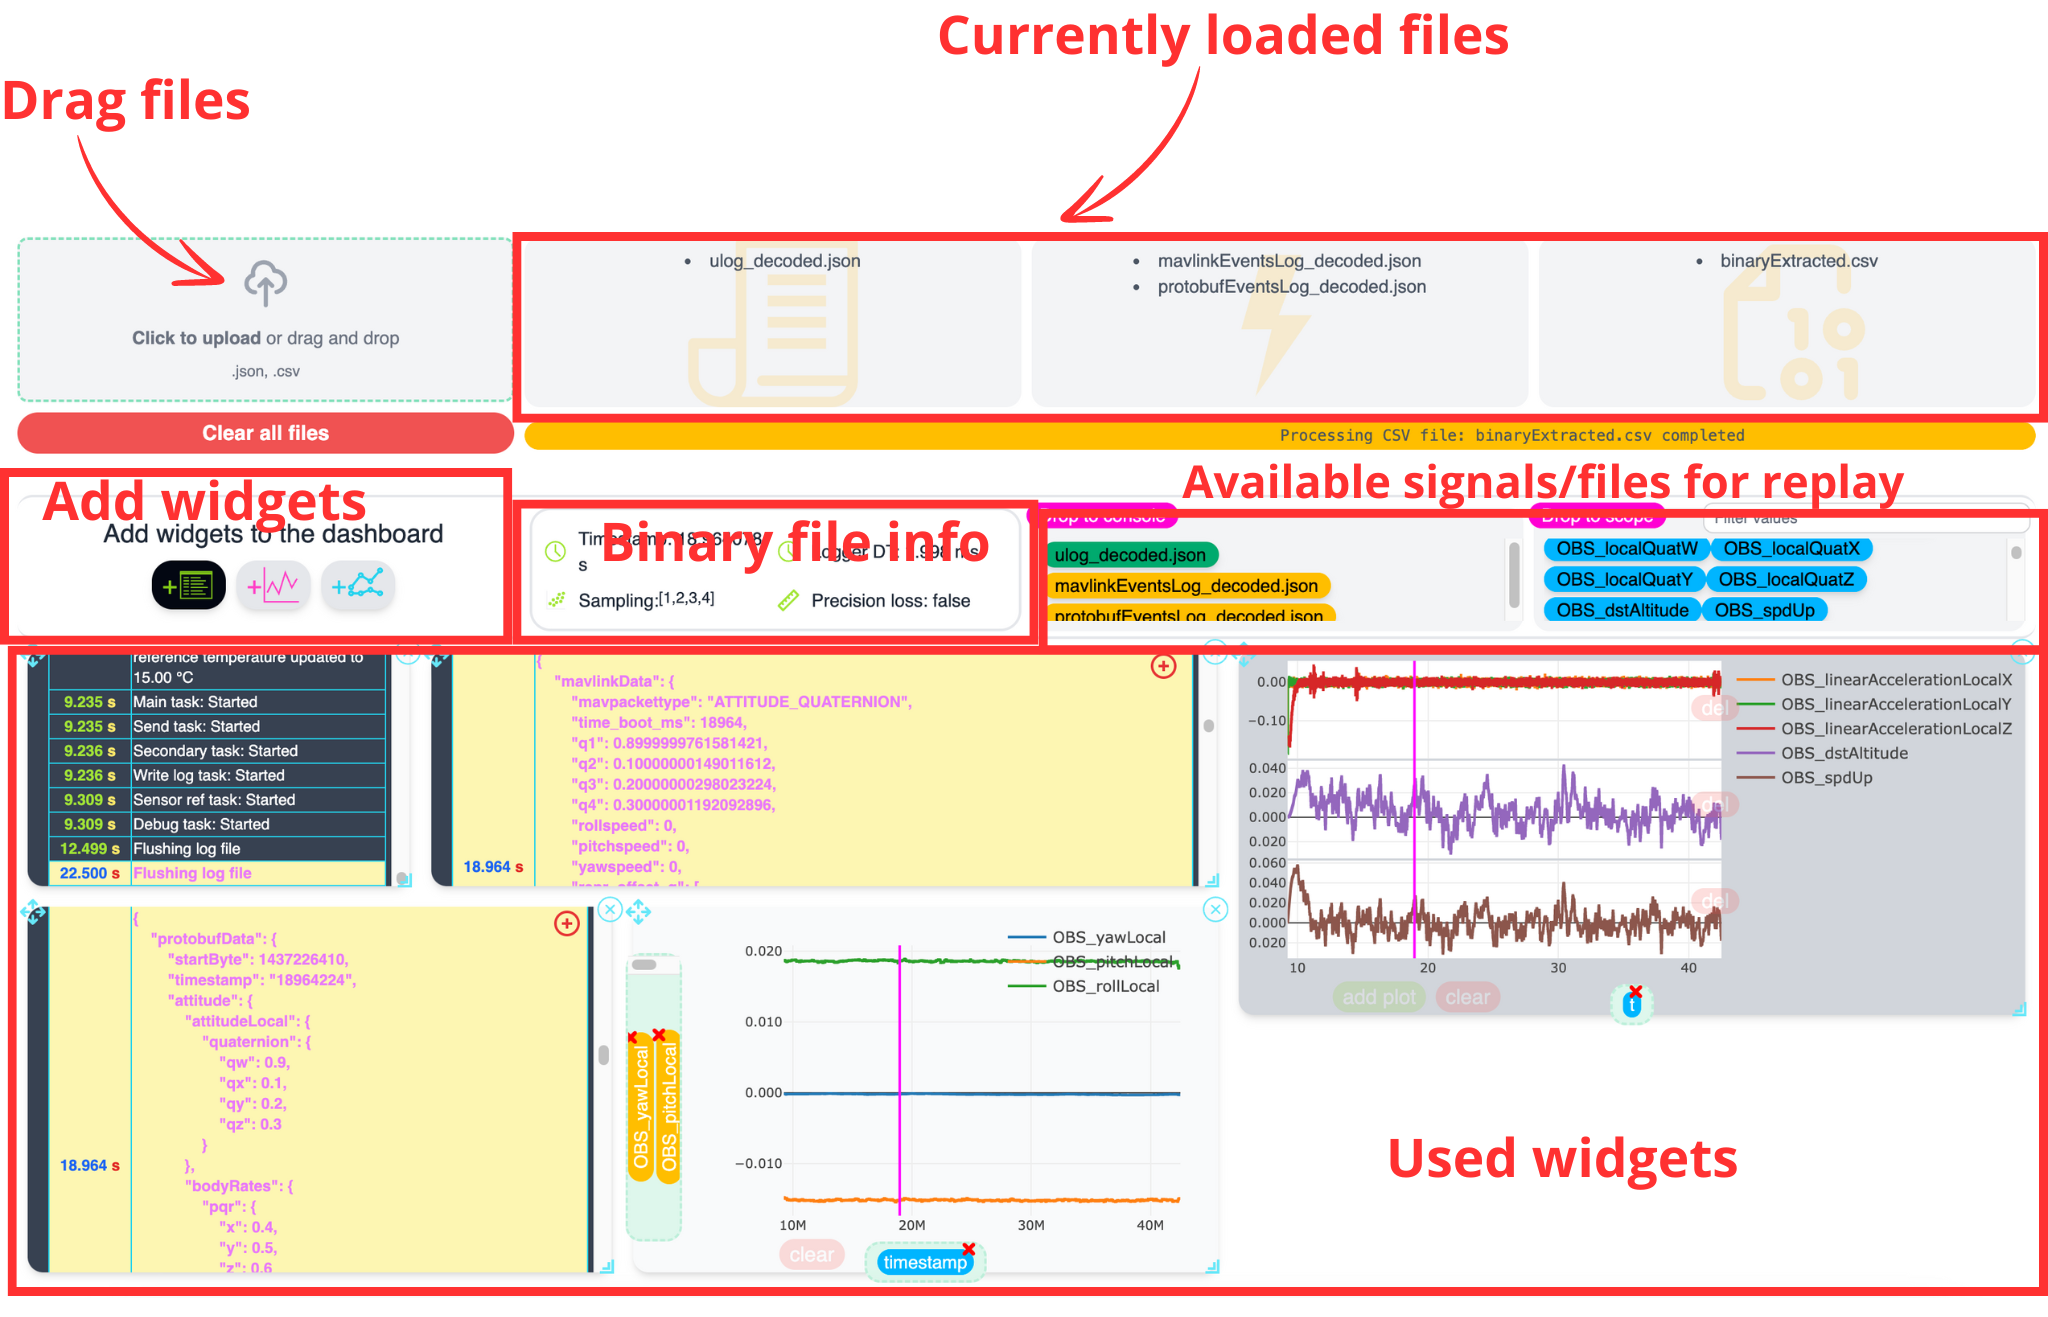
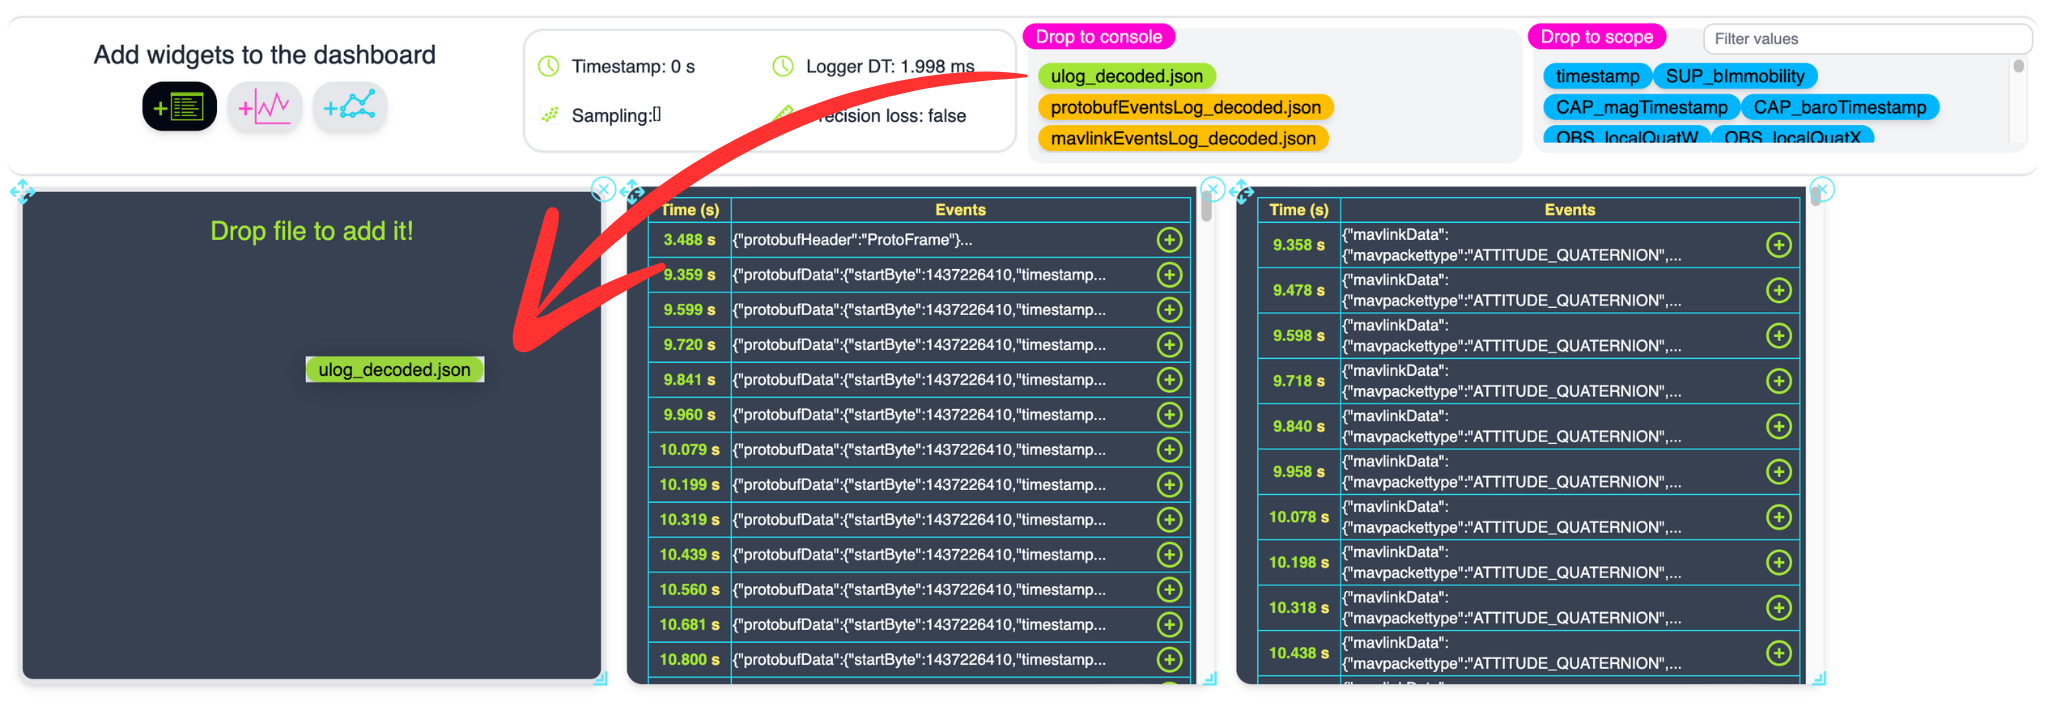
Add files#
You can drag multiple files in the reserved areas. Automatic detection will dispatch the data depending of its type in the loaded files areas.
The available signals/files will be added in the Available signals/files for replay areas:
In the Drop to console area: text logs and events are placed here. They can be dragged in a terminal widget
In the Drope to scope area: variables from binary logs
See also
With heavy files (> 1GB with hours or binaries), log will be sampled for high responsivity. The Sampling array will indicate the divider used for sampling. These available dividers will be used during zoom_in/zoom_out in order to reduce the data on screen. This will ensure fast operations even with million of values! The absence of 1 Sampling factor, indicates that we are facing precision loss -> even with the highest zoom level, the plot will not represent the data with the original sampling rate to preserve fluid operations. This state is indicated with the Precision loss field.
Add widgets#
Using the toolbar Add widgets to the dashboard, you can add widget to replay the content from the log:
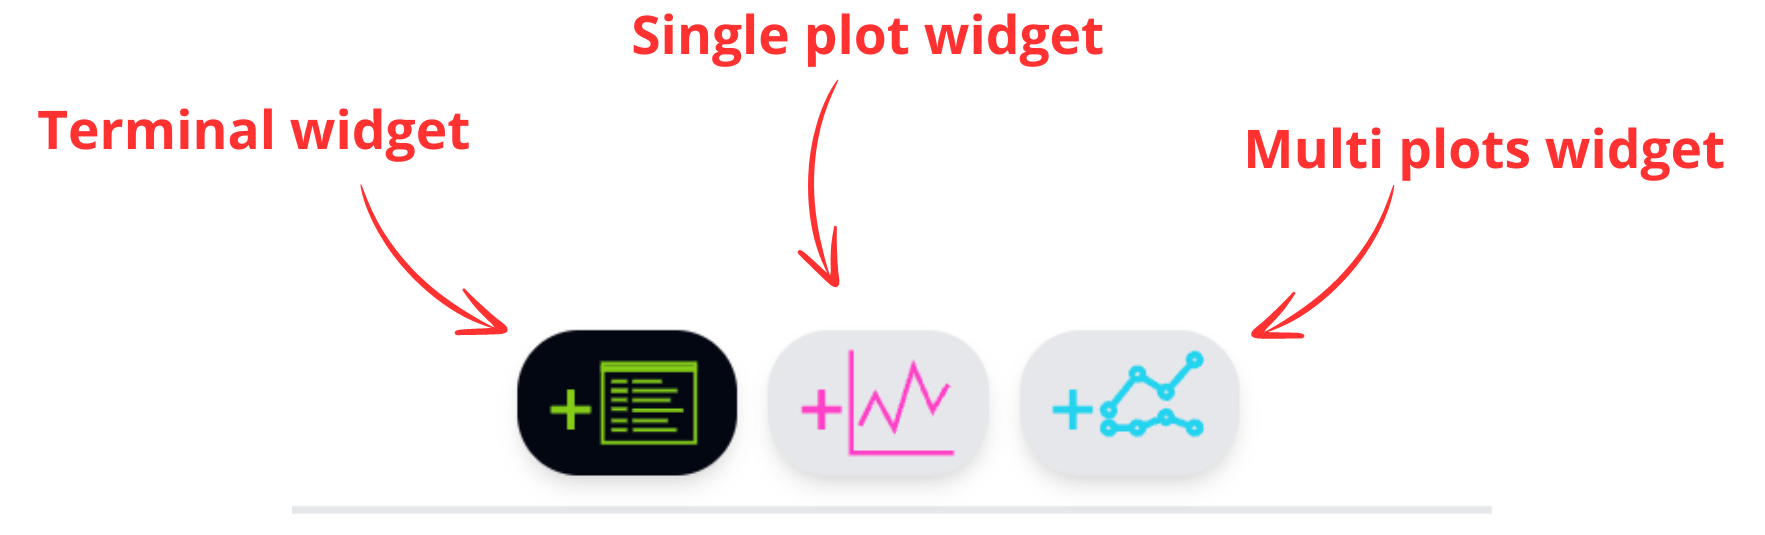
The widgets that can be added are:
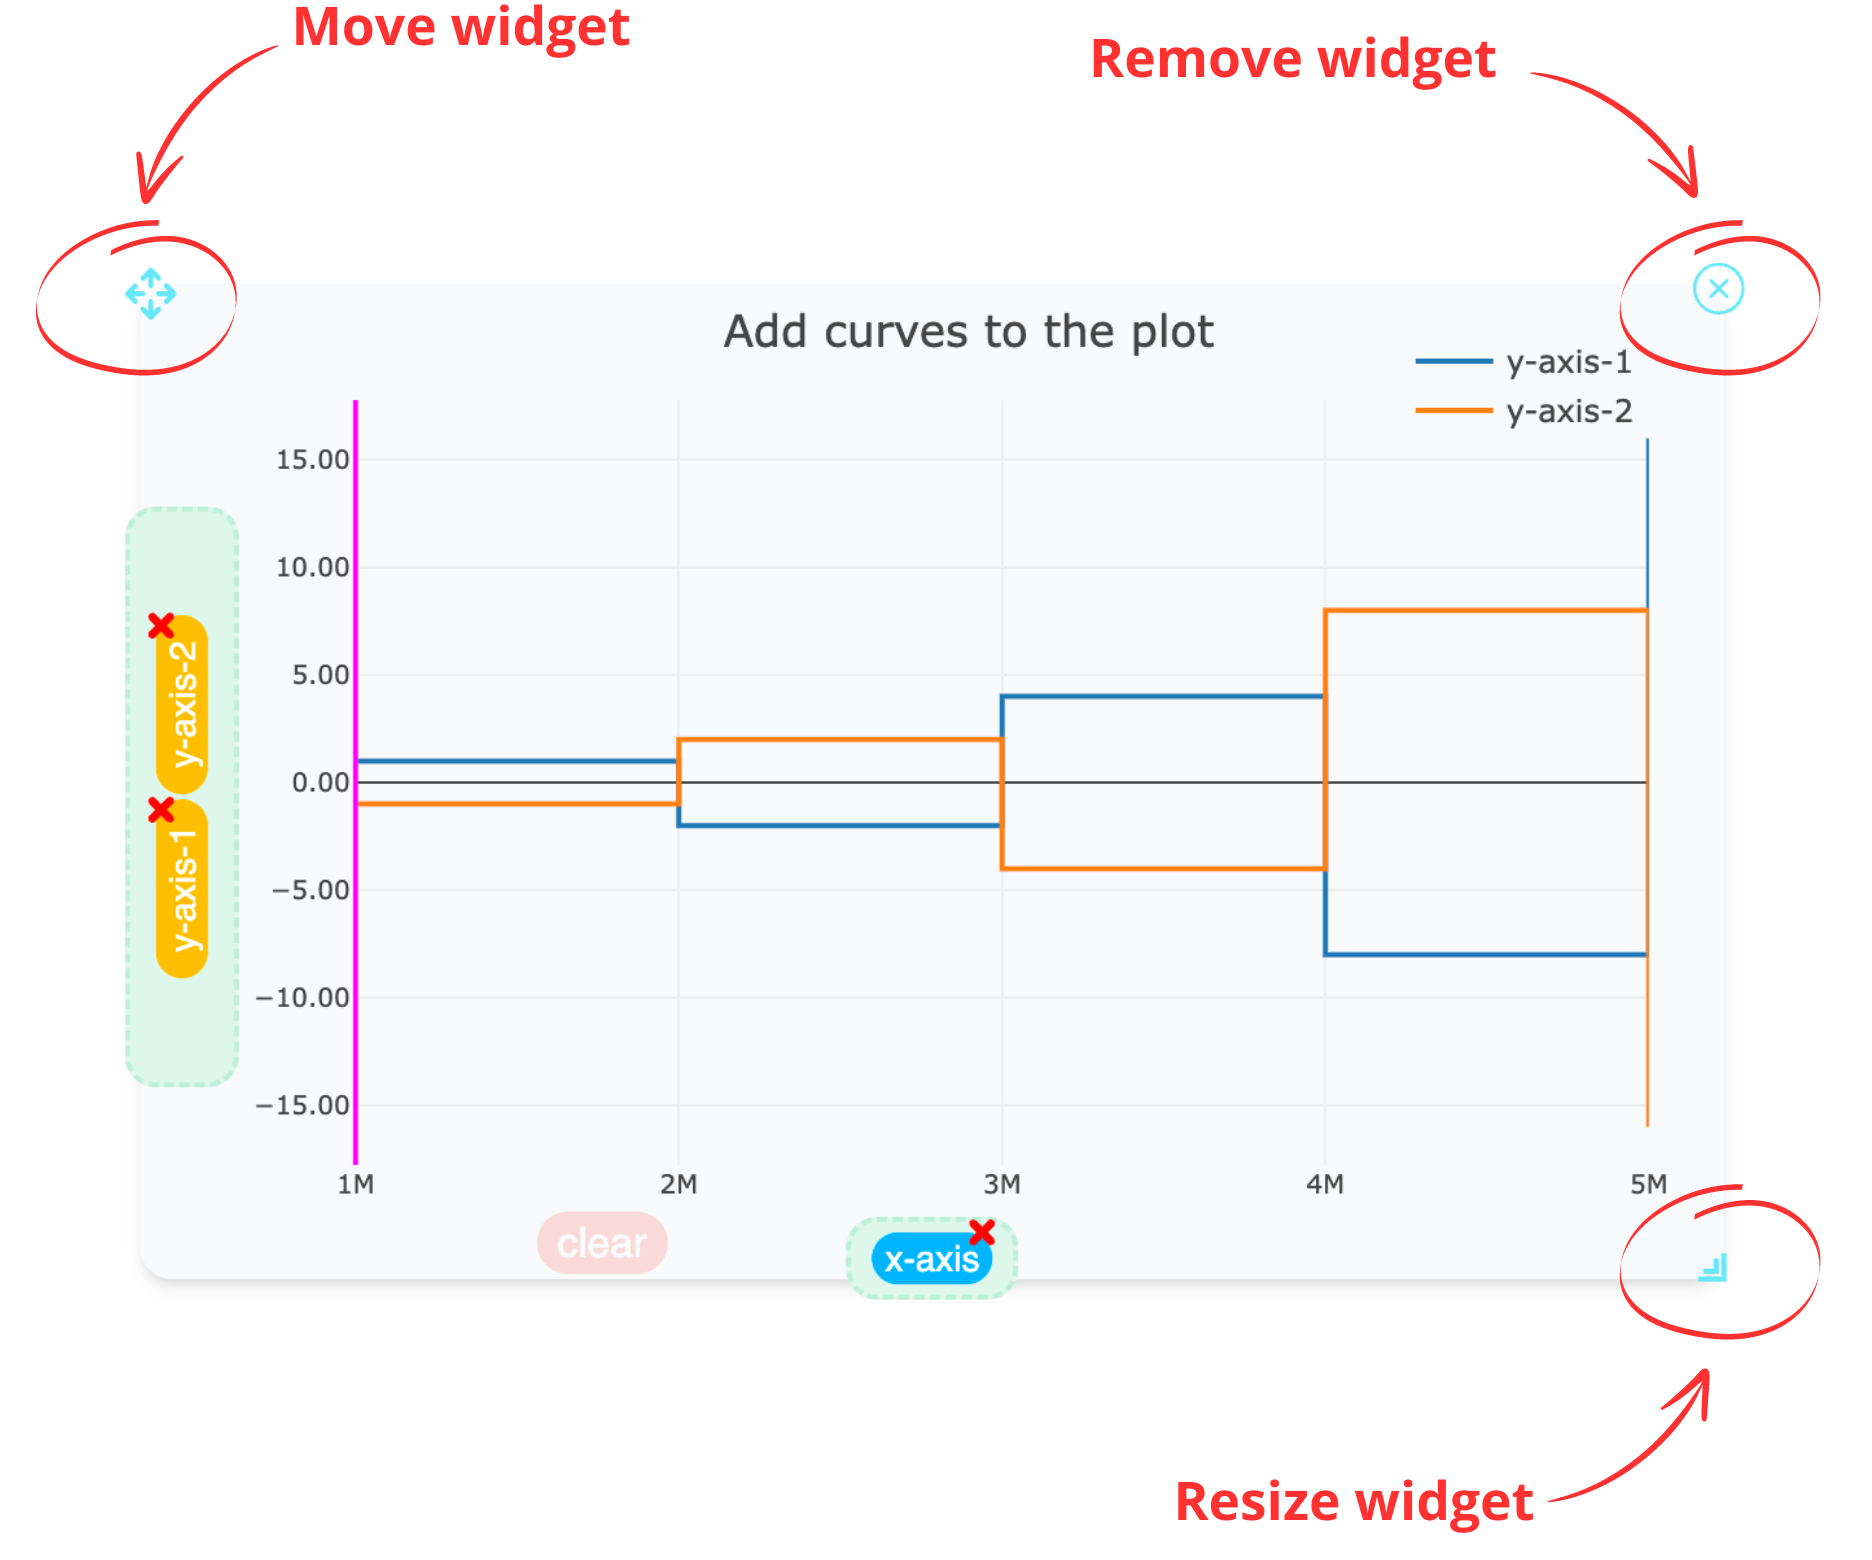
Organize dashboard#
You have the possibility to resize, move, remove the widgets in order to organize the dashboard in order to have the most efficient organization for your data.
Synchronization mechanism#
The data from log with Sysrox Protobuf Logger are synchronized using 64 bit timestamp. This timestamp is shared between all the widgets and reported from one to the the others. Any event or text selection, as well as a cursor displacement will lead to resynchronize all the other windows added.
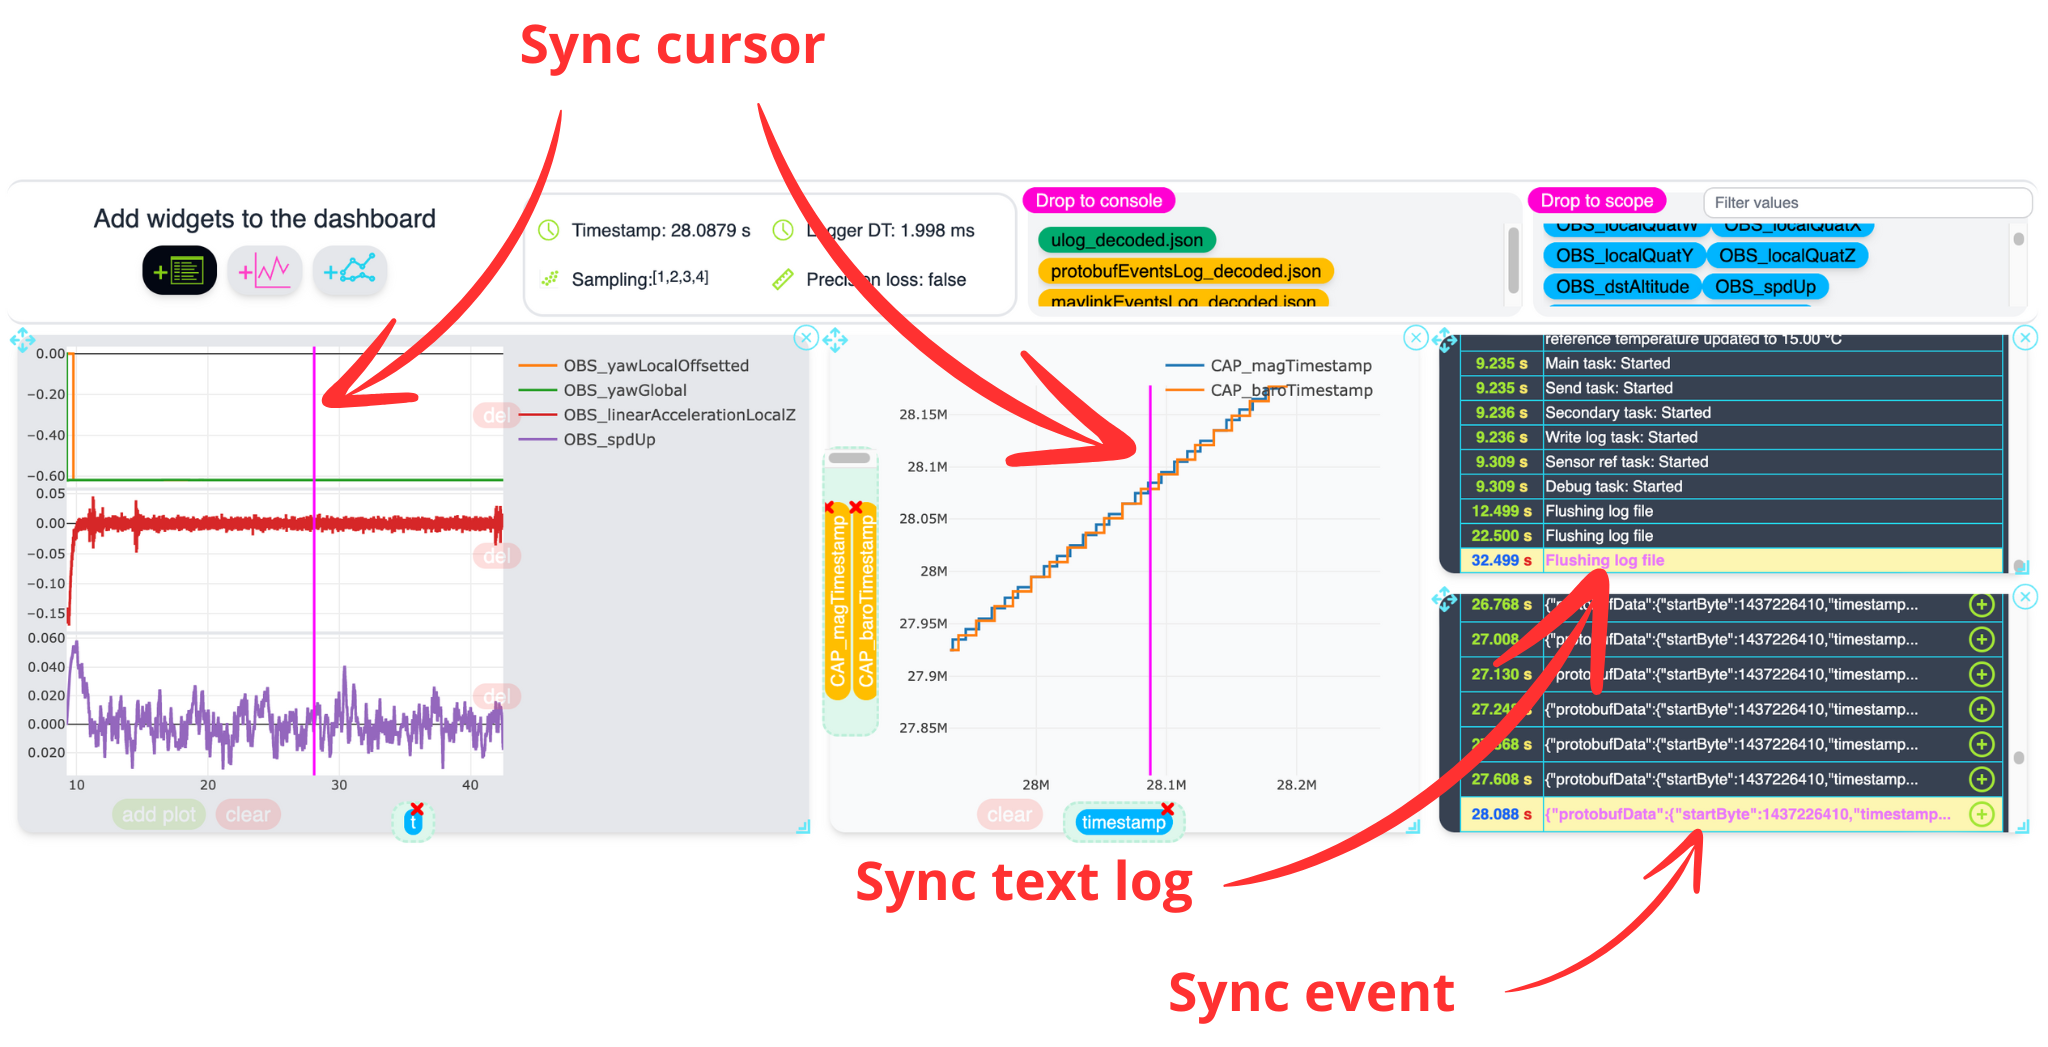
The current synchronization timestamp will be printed in seconds in the Timestamp area
Caution
The timestamp that is used for synchronization is the logger timestamp. It does traduces the moment when the information is logged and is not always the best information to use for precise synchronization task. For example, for the binary logged data from fusion, it is recommended to add a timestamp (from hardware timer) to the logger for the task that is running the fusion process. This will allow this variable to be logged with the fusion data with perfect synchronization with the data from this step.
Feed and organize widgets content#
Each widget can receive data in order to display it. Events and text logs can be displayed in terminal type widget. Binary logs can be displayed in single plot or multiplot widgets.
Tip
To add an information (event, text log or binary data) to a widget, extract informations from log then drag the colored pill to the widget in which you want to display information
Terminal#
Terminal widget is used to display text files or events (mavlink, protobuf).
You can then navigate through the events and text content logged. Events can be folded/unfolded to unvail content.
The synchronization timestamp is updated with clicking on a row.
Single Plot#
The single plot device allows to plot data of the same size with any abcisse/ordinate. It allows easy addition/deletion of ordinate and can be a great addition to the Multiplots tool too display data series:
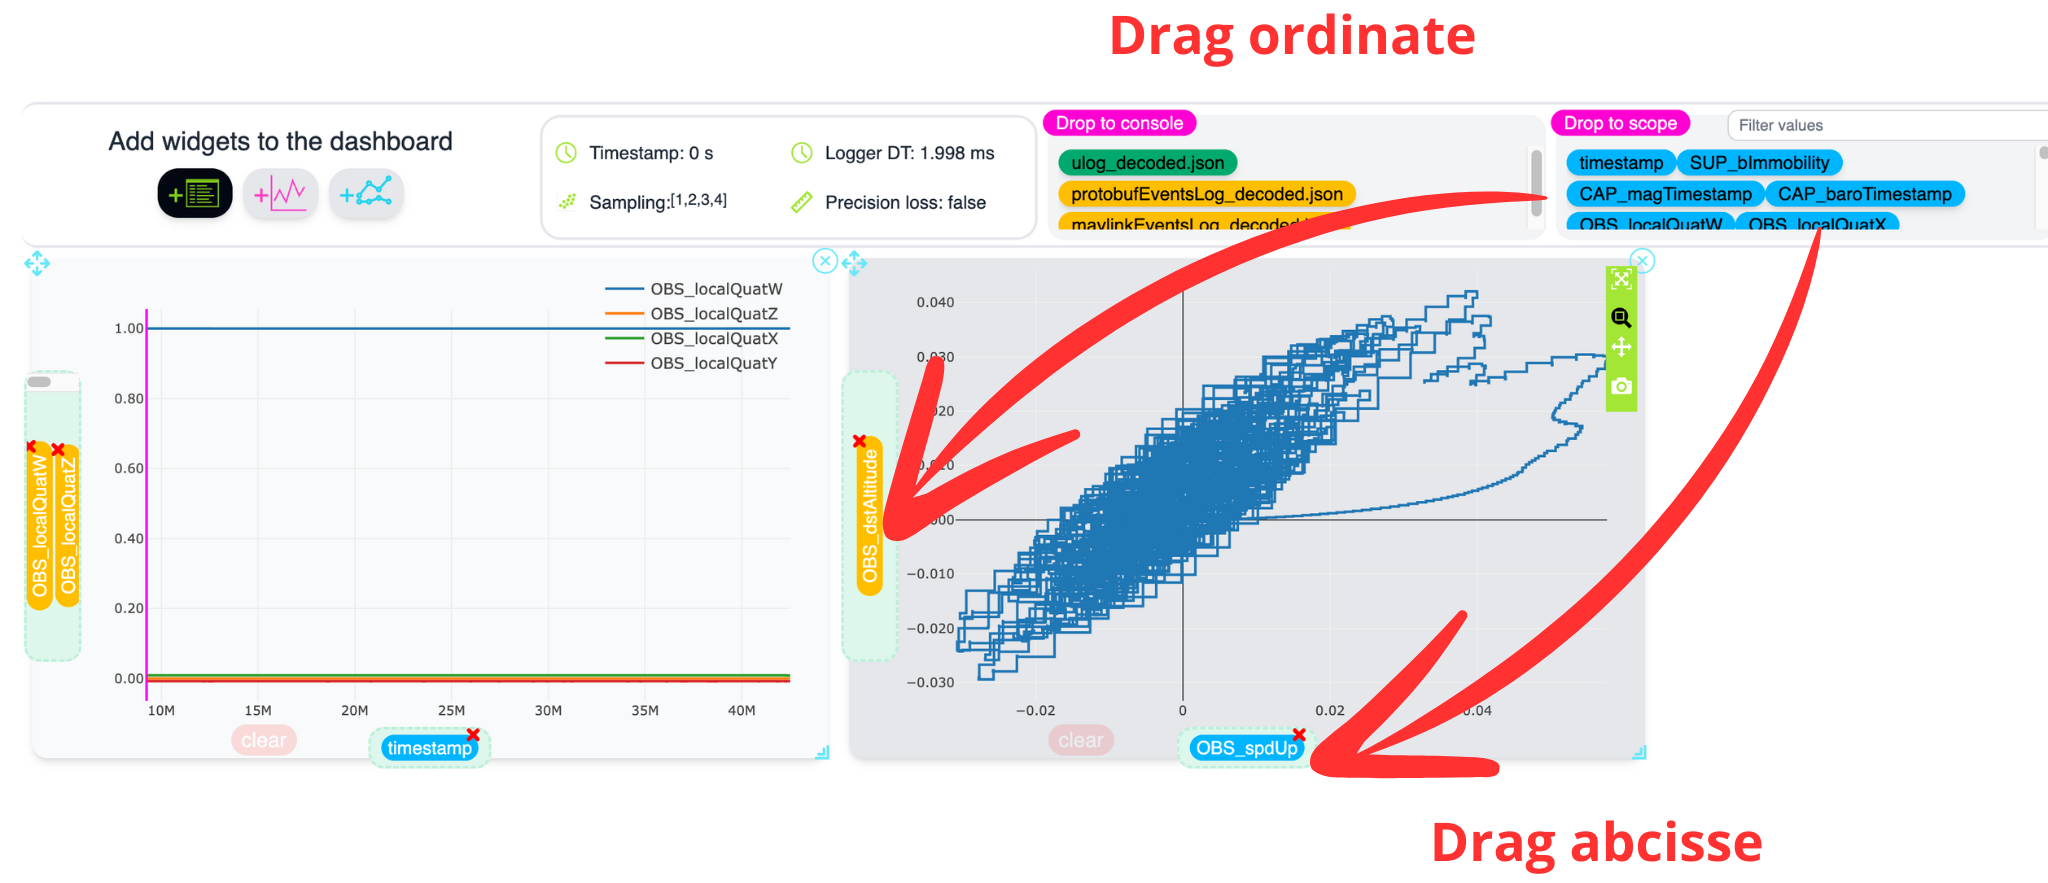
The synchronization timestamp is updated with clicking directly on the plot (cursor);
Multiplots#
Multiplot allows to plot multiple superposed curves with the same axis. It is ideal for temporal series.
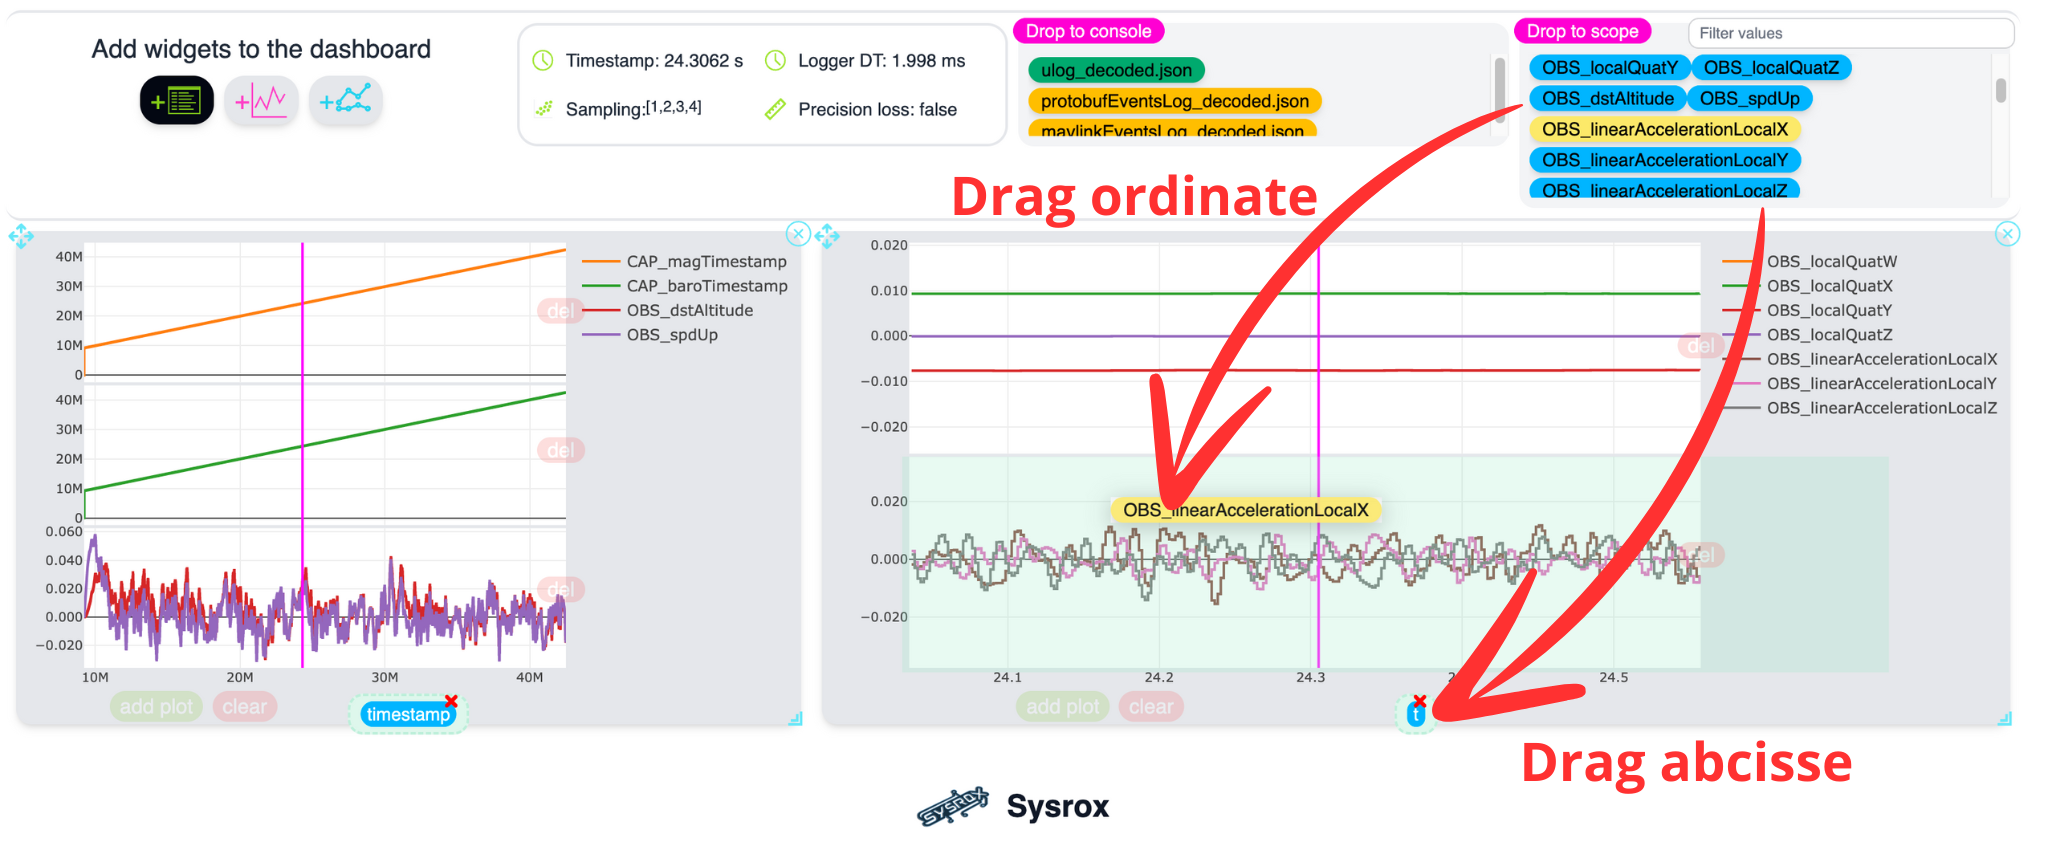
The synchronization timestamp is updated with clicking directly on the plot (cursor);